veilles / 24 Juil 2013
Screen Life
‘Screen Life’ research from Thinkbox reveals how audiences choose between watching Television programmes live or on demand (VOD) and between different types of VOD. In revealing the attractions of VOD, Screenlife 2 has provided valuable insights into why live TV remains so dominant as a way viewers watch programmes
What is it?
The study – ‘Screen Life: TV in demand’ – was commissioned by Thinkbox from Flamingo and Tapestry. It involved the analysis of over 100 hours of footage from 18 households from across the UK for two weeks. It also involved a survey of diary study of 662 adults, across 3,692 viewing occasions providing 250,000 data points for analysis.
The research sample was more technologically advanced than average. All respondents owned a smartphone and 46% owned a tablet. Crucially the sample was also heavy VOD viewers with 74% of the sample watching VOD at least once a week. This compares with the 52% of the UK who has ever watched VOD, according to IPA Touchpoints data.
The 6 reasons we watch TV
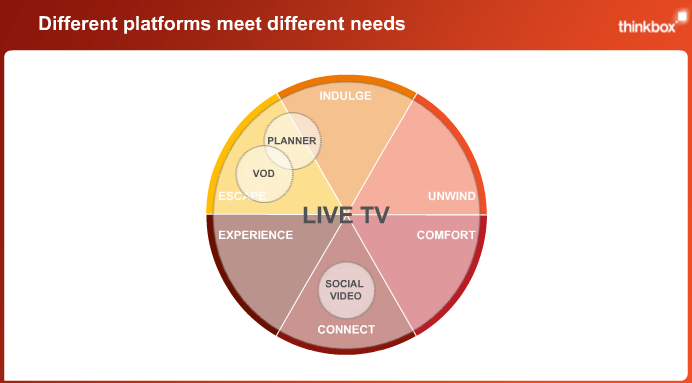
The study explains why, in an era when people can choose to watch what they want when they want, the UK continues to watch live TV 90% of the time: the live TV experience satisfies human emotional needs that on demand viewing alone can’t.
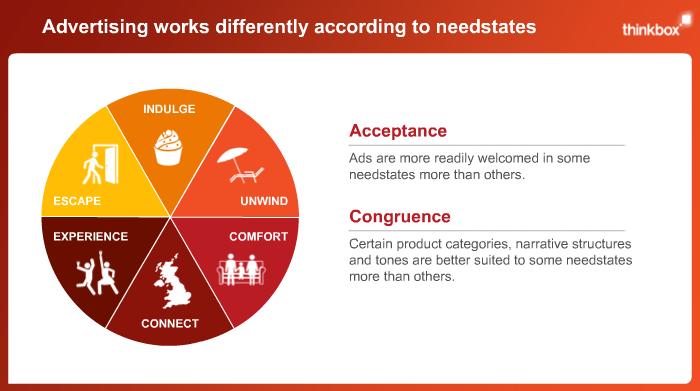
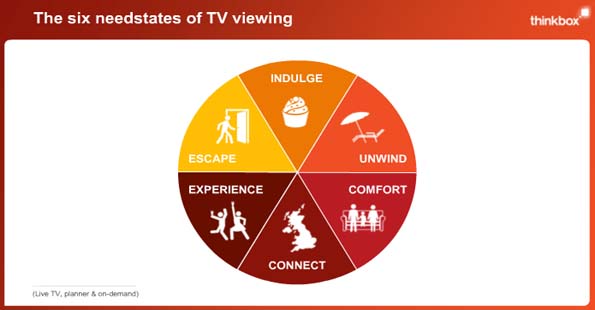
The researchers identified six core reasons why people watch TV:
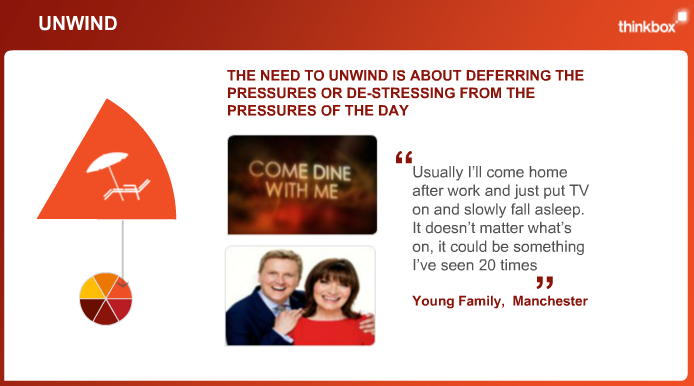
- Unwind: defer life’s chores or de-stress from the pressures of the day
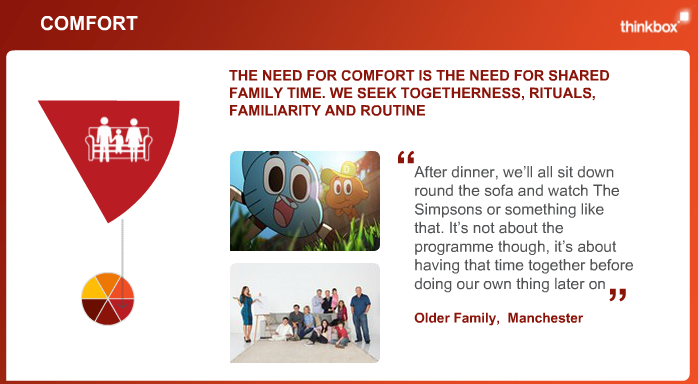
- Comfort: shared family time; togetherness, rituals, familiarity and routine
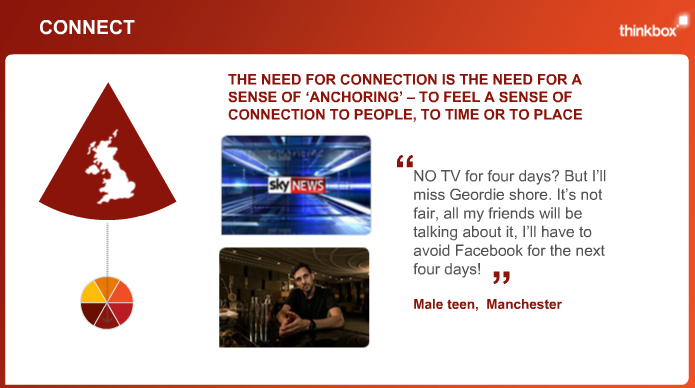
- Connect: a sense of ‘plugging in – to feel a sense of connection to society, to time or to place
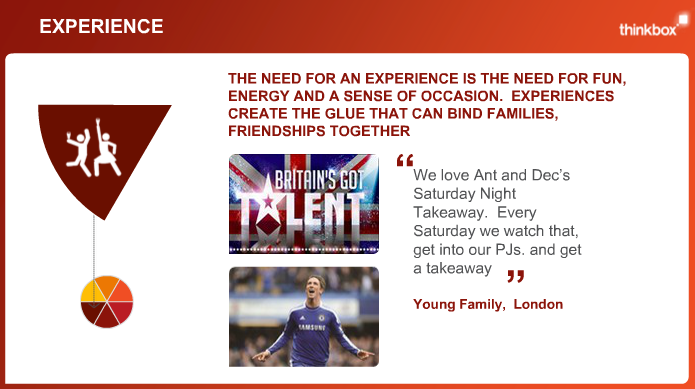
- Experience: a need for fun and a sense of occasion to be shared
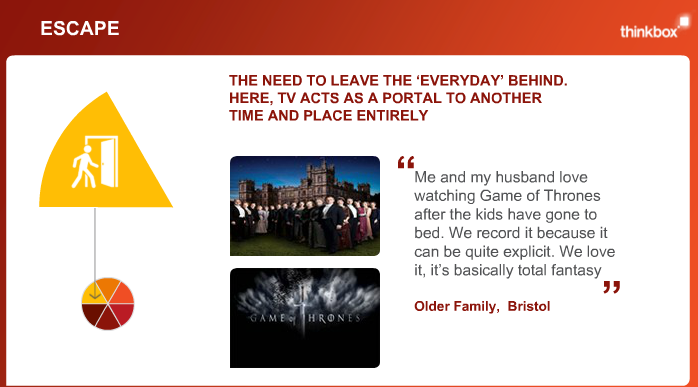
- Escape: the desire to be taken on an enjoyable journey to another time and place
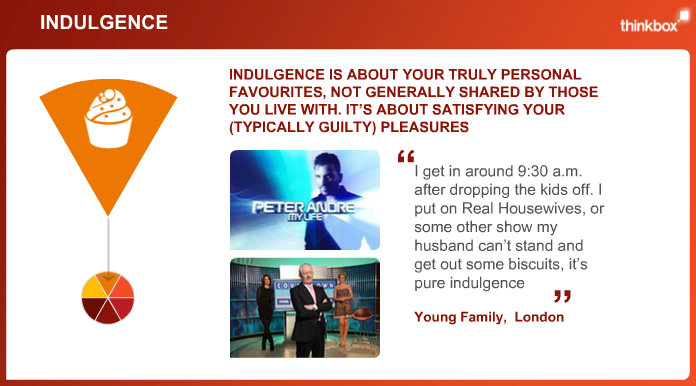
- Indulge: satisfying your (typically guilty) pleasures with personal favourites, usually alone
Man cannot live by VOD alone
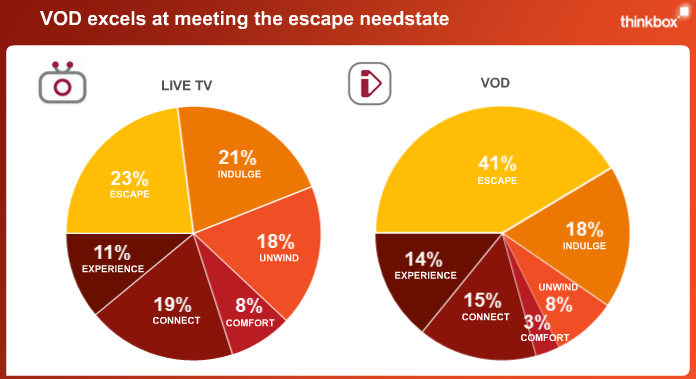
VOD excels at satisfying personal approaches to TV, specifically indulging and escaping, but it is less equipped for more social needs such as unwinding and seeking comfort. This is supported by the finding that for 54% of the occasions we watch live TV we’re with someone else compared to 30% for VOD. And for viewers who want to connect and feel like they are sharing a TV experience with the outside world, then live TV was judged by far the best way.
Match the ad to the need
The study found that congruent advertising (where the ad creative matches the need state of the viewer) can help advertisers maximise the effectiveness of their campaign – a finding which supports previous studies into congruence. Matching the category or brand, tone and message to the predominant need state of the audience will increase response, especially if this also suits the device being used.
Since live TV satisfies all the need states identified by the study, a wide range of narrative styles and advertisers will fit. Since VOD excels at particular need states, and is currently used on other devices, advertisers need to be more cautious.
‘What’s on’ is first port of call
Even among the heavy VOD viewers in the research sample, 60% typically checked what was on the live TV schedule first before considering other options.
The TV set rules
The TV set is overwhelmingly the preferred way to watch, whatever the reason people are watching. This is especially true of TV for comfort or to unwind, where at least 90% is watched on the TV set.
Young people are happy to wait (so they can share)
Connecting was the most important reason to watch TV for 18-24s. 28% of their viewing was in order to connect – almost double the average from the research sample (15%).
When given a choice between having the option to download a new series they liked in one go or waiting to watch it week by week on live TV, 73% of 18-24s in the research sample said they prefer to watch it week by week. This was more than the older audience of 35-55s (57%).
TV remains rooted in the living room but new devices enable ‘place-shifting’
Live TV is almost exclusively watched on a TV set, however in the study’s heavy VOD-viewing sample, VOD was split across different screens: 37% was watched on the TV set; 45% on a PC; 14% on a tablet; and 4% on a smartphone.
The further away people go from live TV, the less likely it is they are watching on a TV set. Only 5% of social video – such as on YouTube – was watched on a TV set, compared to 62% on a PC, 11% on a tablet, and 22% on a smartphone. It is also less likely they are watching with someone else: 54% of live TV viewing was with someone else compared to 30% on VOD and 19% on social video.
Social video is also watched in different locations: 34% in the living room, 56% in another room, and 10% out of home. For VOD this place-shifting is evident but less pronounced with 51% of viewing in the living room, 43% in another room, and 6% out of home.
Neil Mortensen, Research and Planning Director, Thinkbox: “This research gets to the heart of why we watch TV and explains the apparent conundrum of why people choose to watch so much live TV when they don’t have to.
“It shows that VOD is a brilliant and treasured new way to enjoy TV, but it can’t give people everything they demand from TV – particularly the highly valued social elements. Live TV is best equipped to meet all of the needs and that is why it will endure, no matter what new platforms emerge. Live TV is our daily food whereas VOD is more like a box of chocolates.”
About the Screen Life series
Thinkbox’s series of ‘Screen Life’ research studies look at emerging TV technologies and behaviours. The first study, ‘Screen Life: The View from the Sofa’ was designed to help the advertising community understand the context of multi-screening (watching TV and simultaneously using an internet-connected device such as a laptop, smartphone or tablet). It picked up multiple research awards, including the MRG (Media Research Group) Grand Prix for best media research of the year 2012. You can read all about it here.